

Axe Devtools Extension
To start using Axe monitoring to scan webpages prior to publishing, you can download the extension for your preferred browser, Chrome, Edge, or Firefox.
Axe Devtools in Chrome
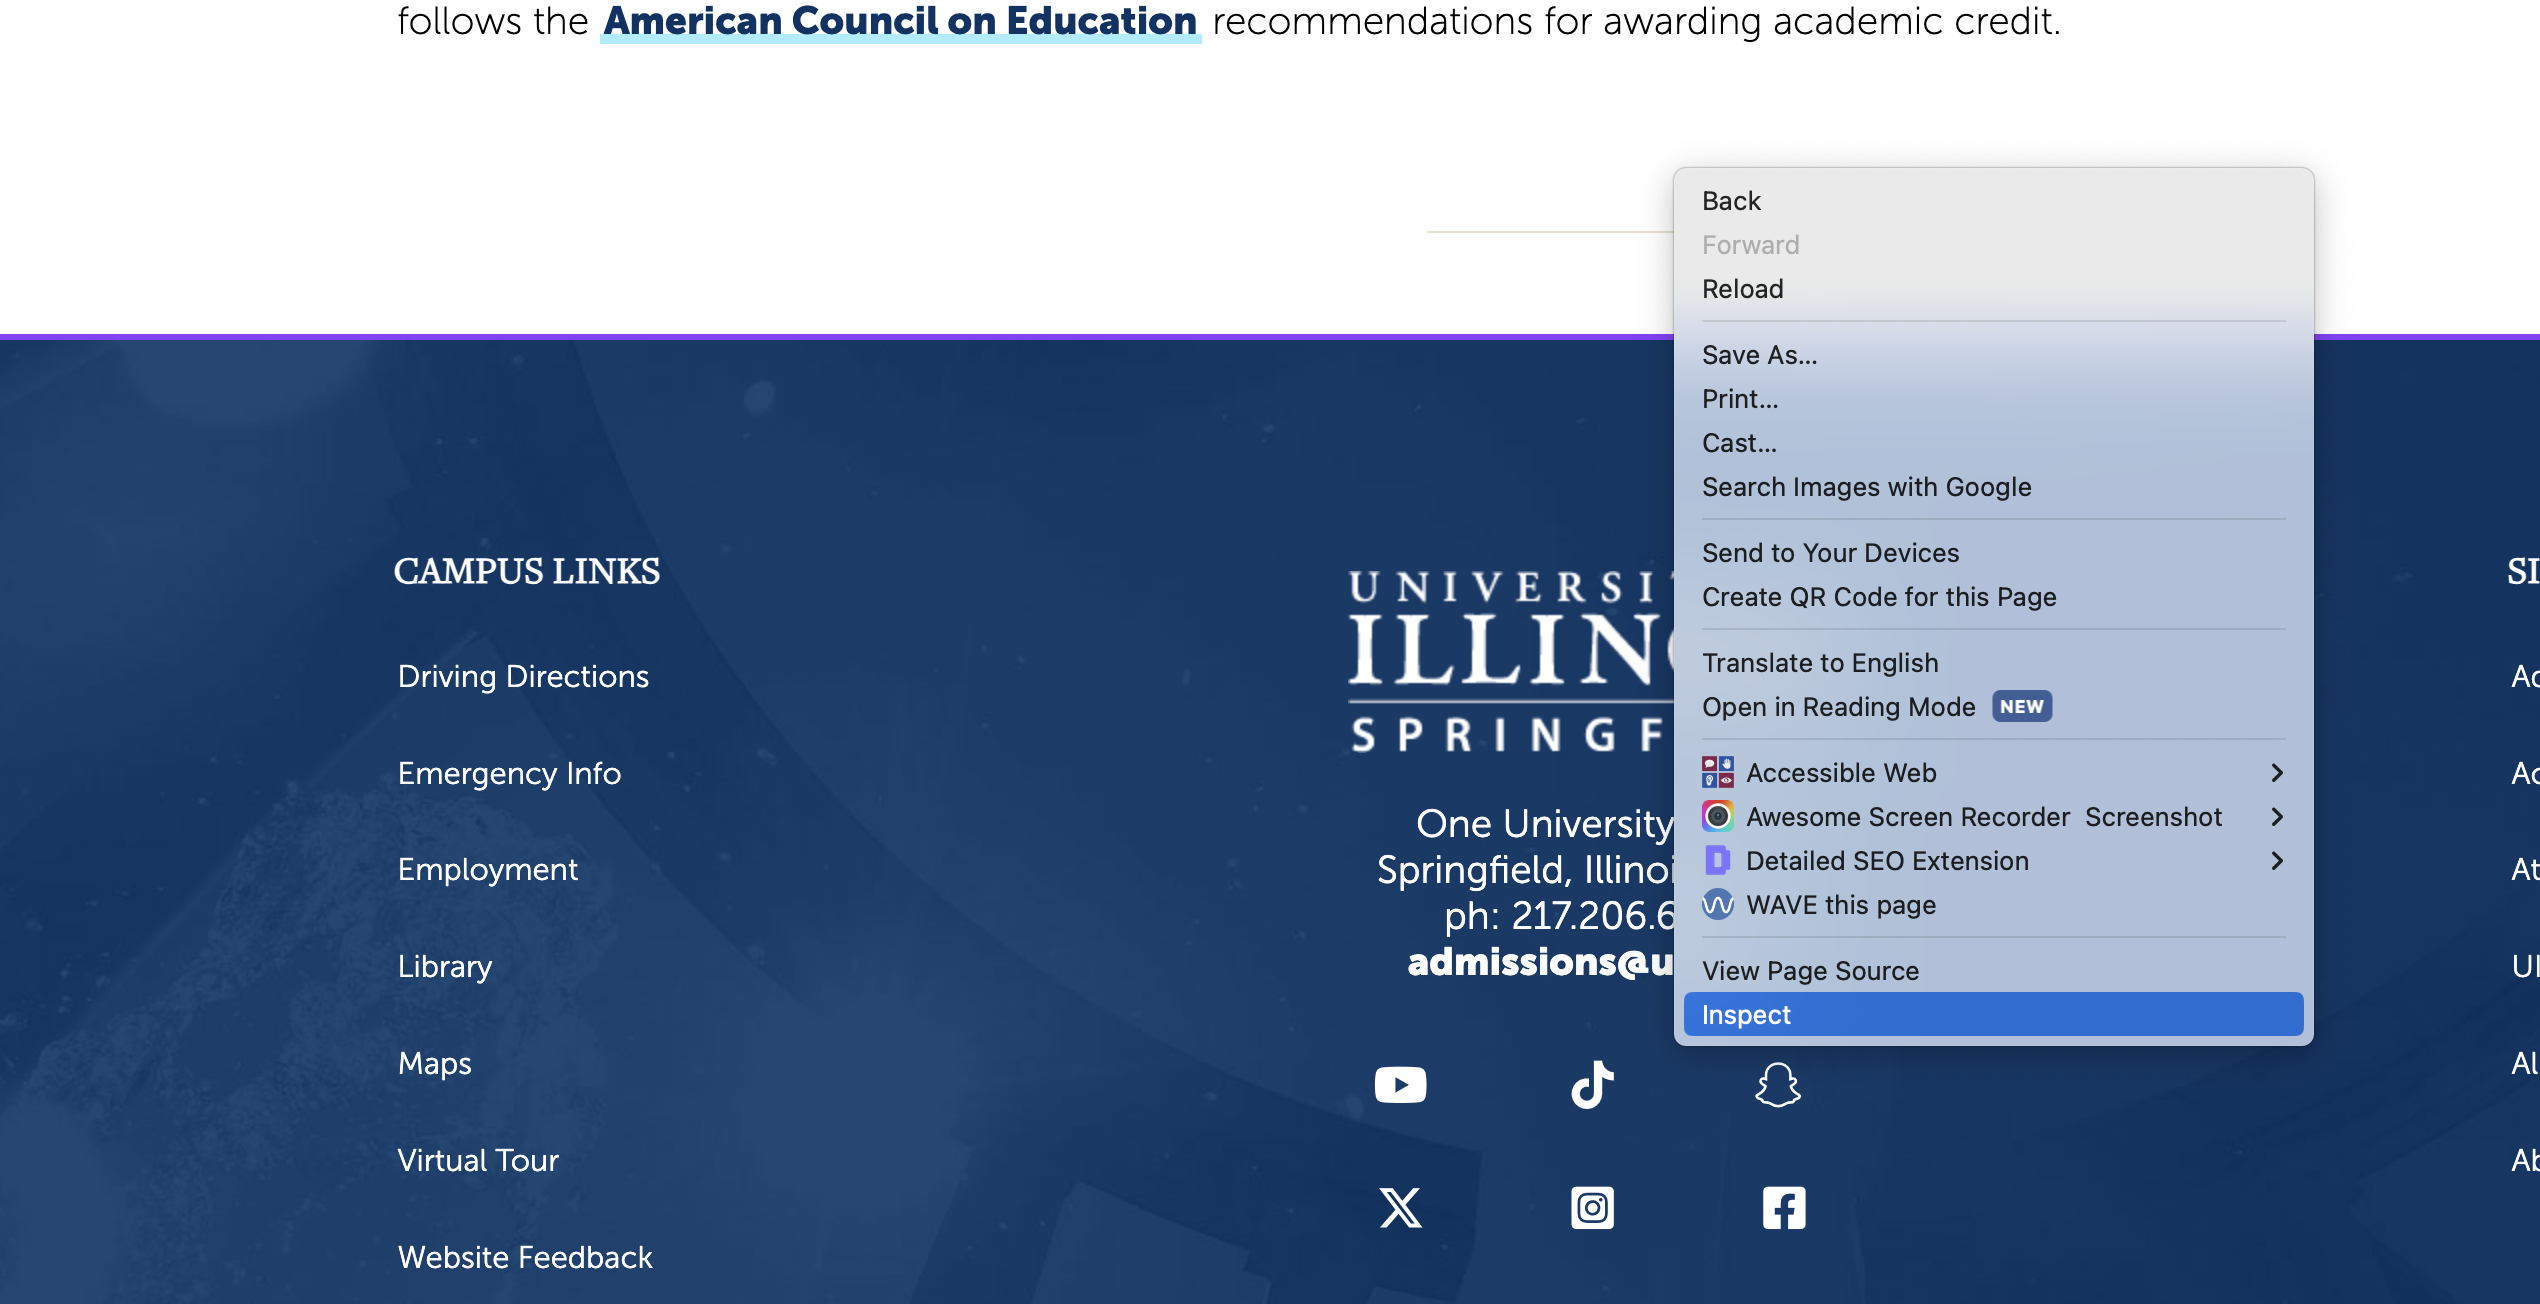
Once you have installed the extension, in order to use, you will need to right click on the page you want to scan, and click Inspect Code.
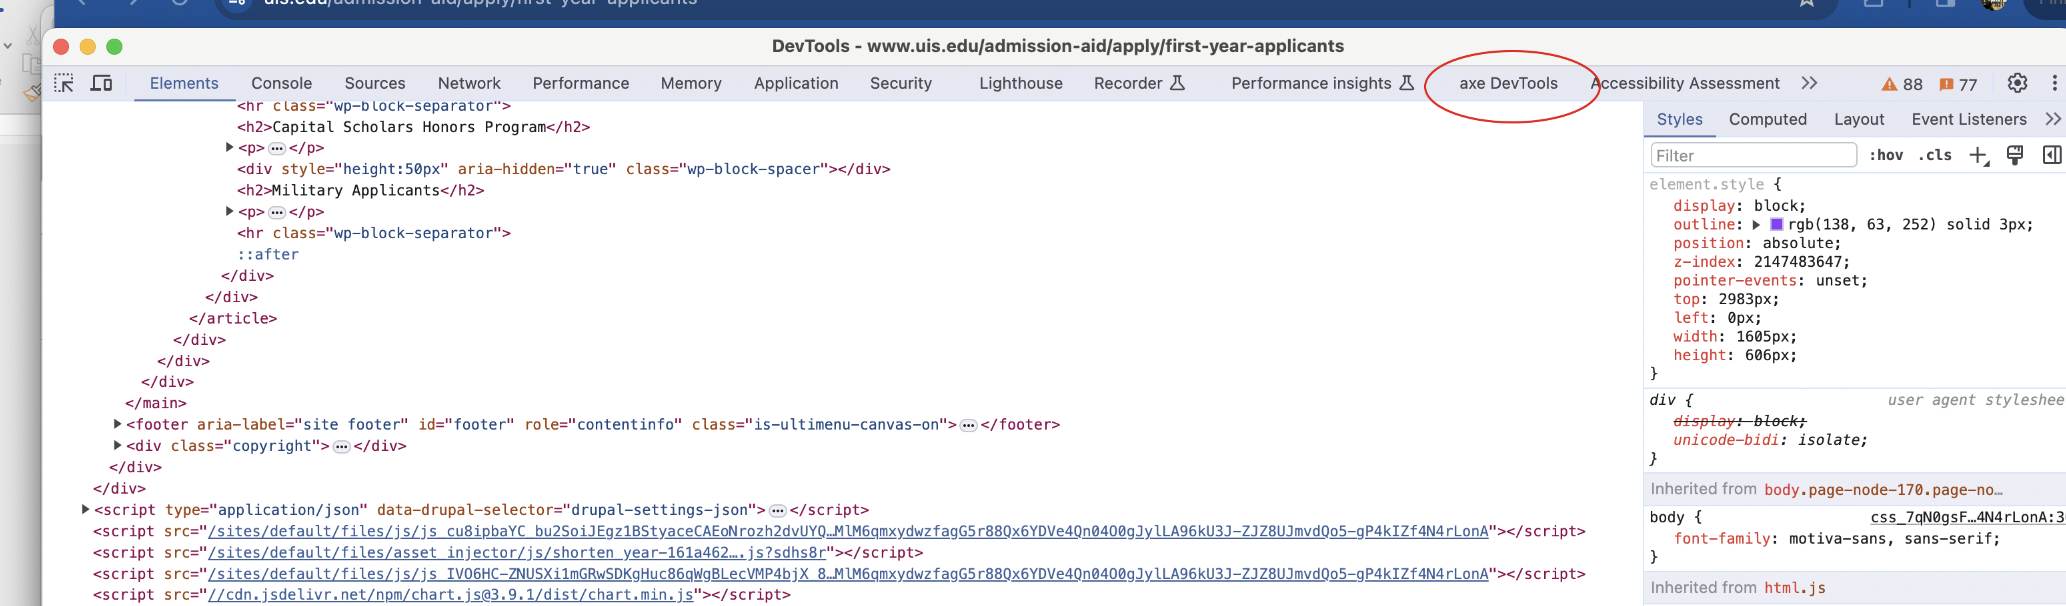
Once you click inspect, the Chrome Devtools window will open. Click the axe Devtools tab in the top menu bar.
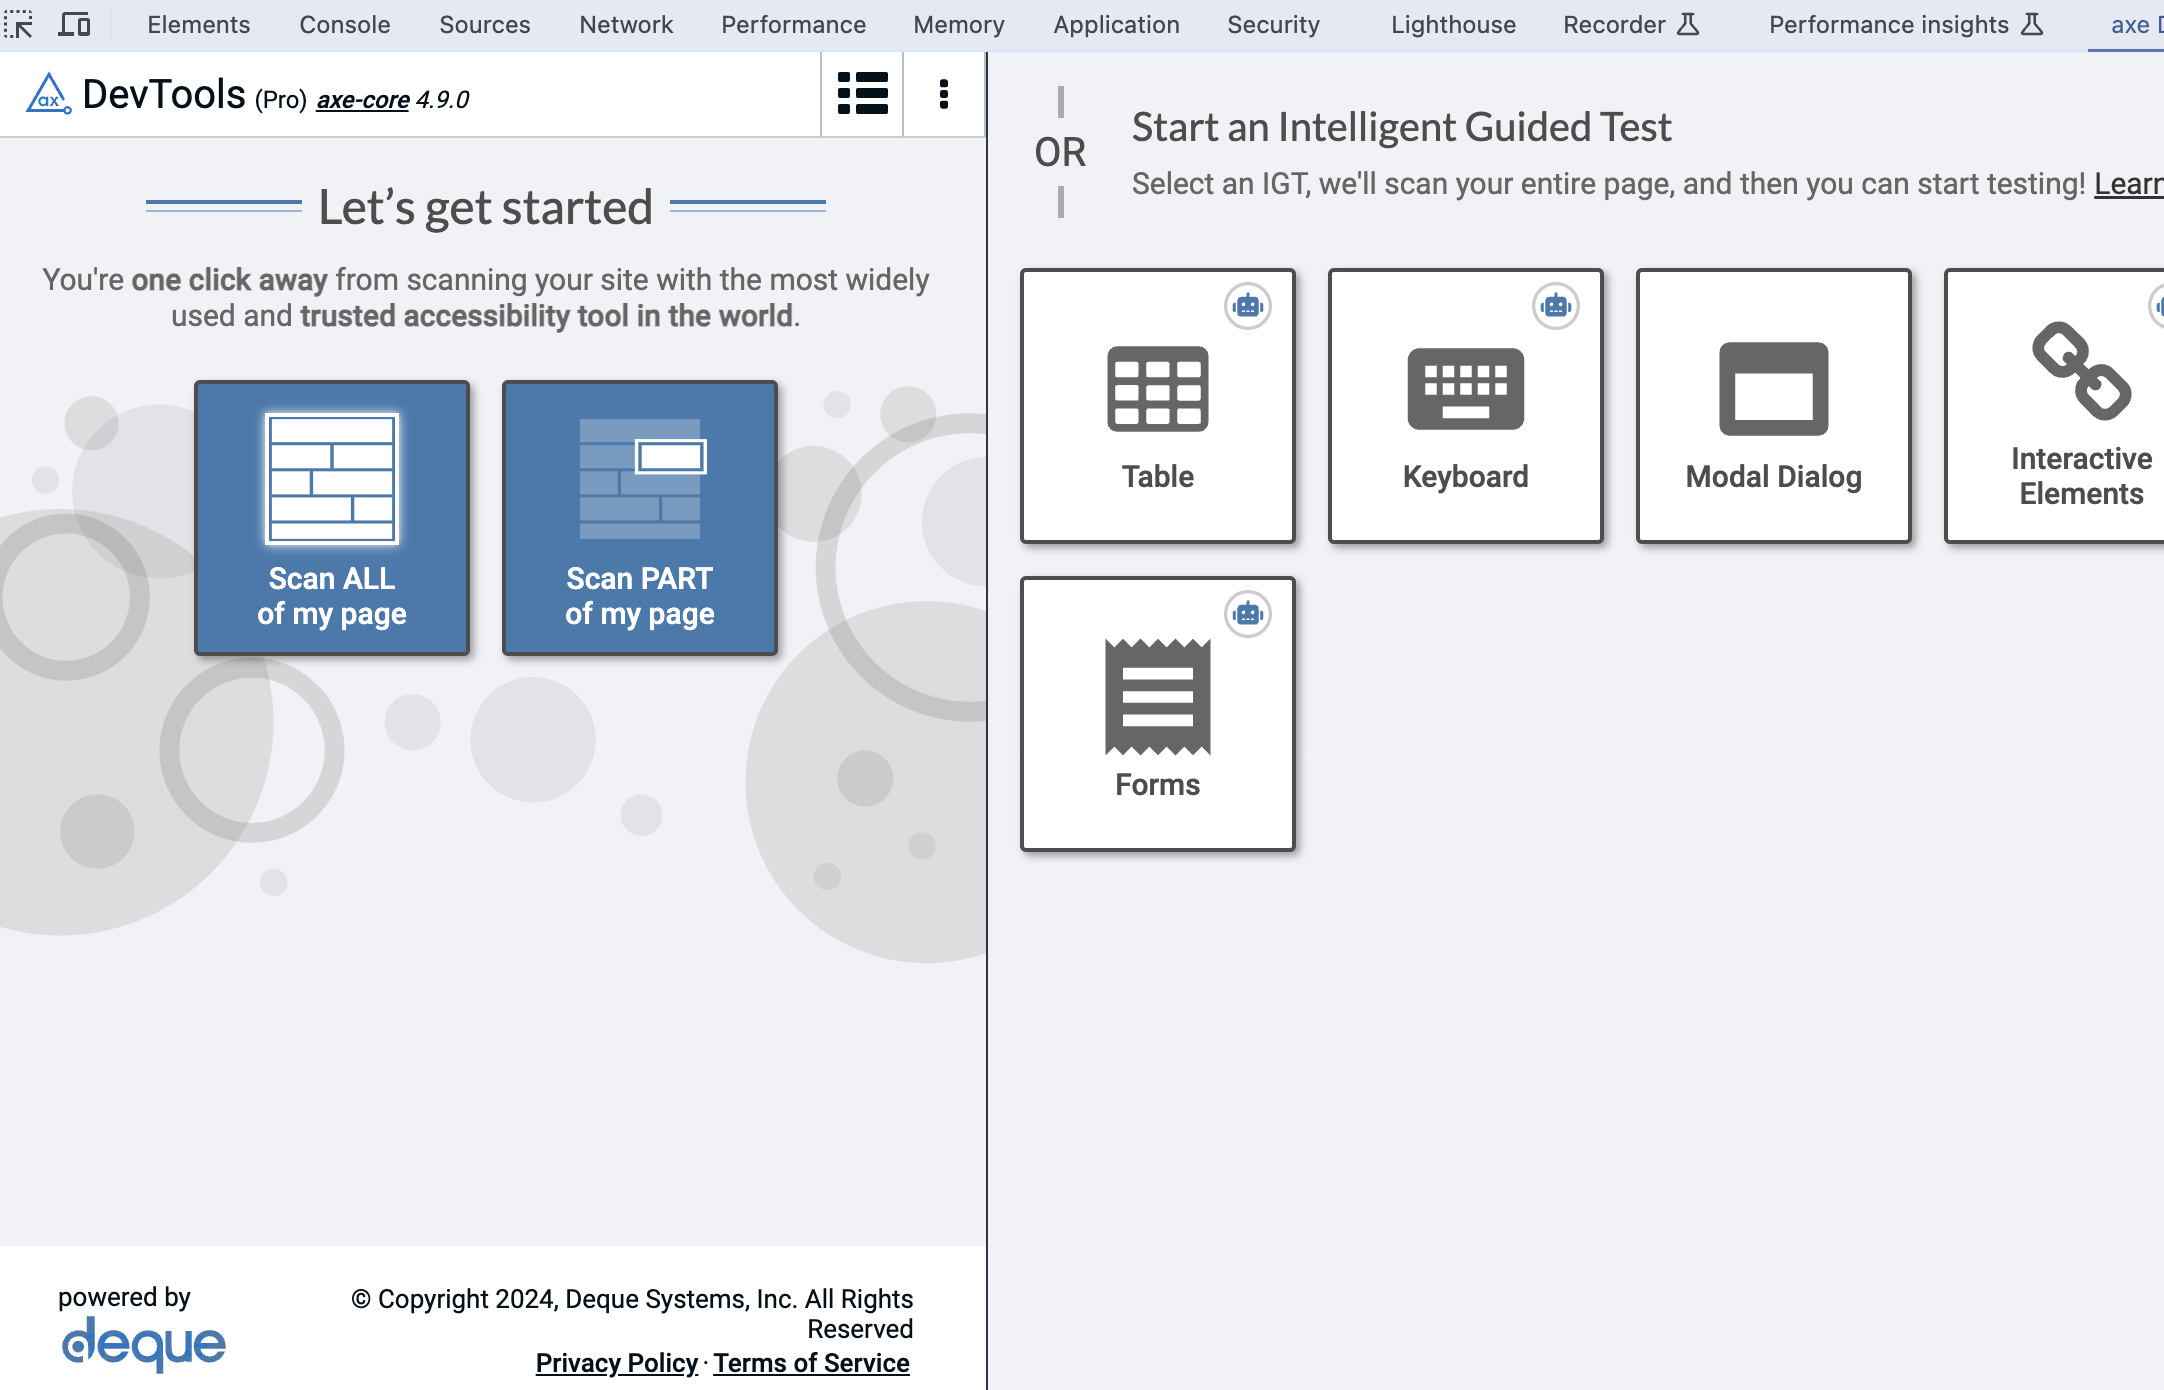
In the axe Devtools window you will see the different scanning options. You will first need to Sign in to start using the tool.
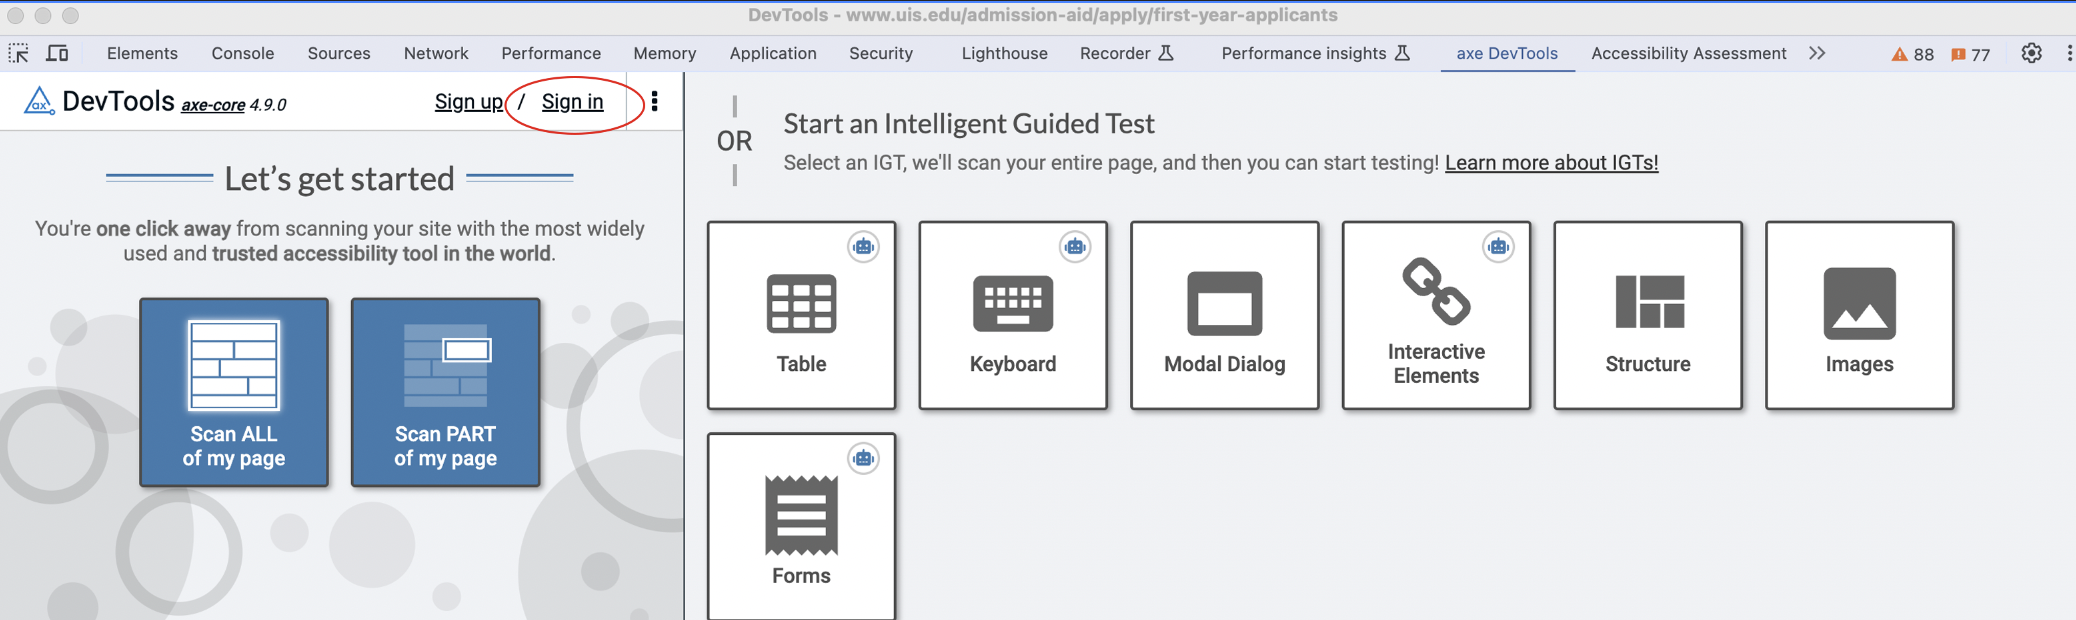
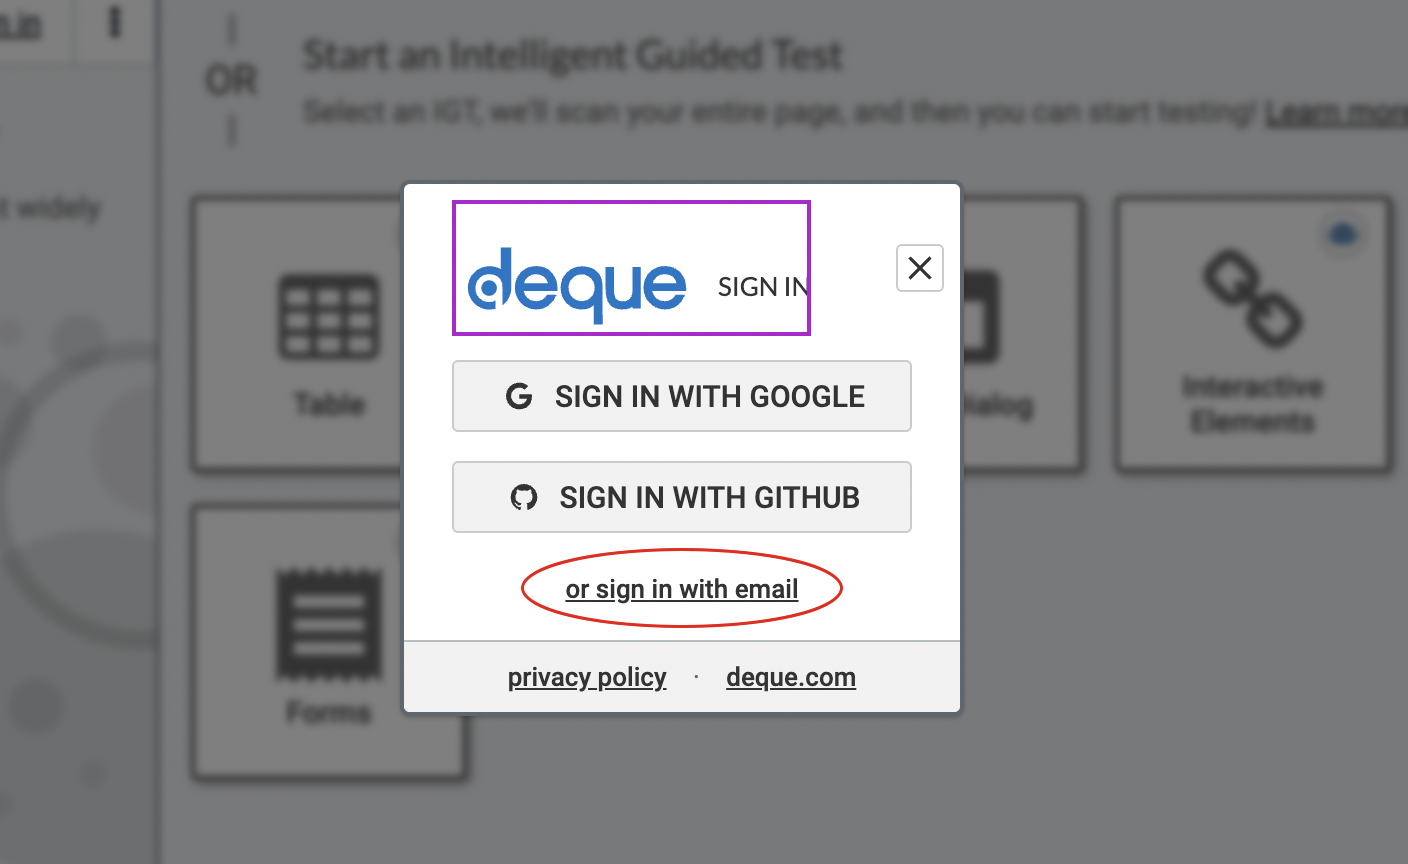
Click the 'sign in with email' link under the main buttons. A window will open within the browser to let you sign in with your netid and password.
Then go back to the devtools windon and select 'Scan part of my page'.
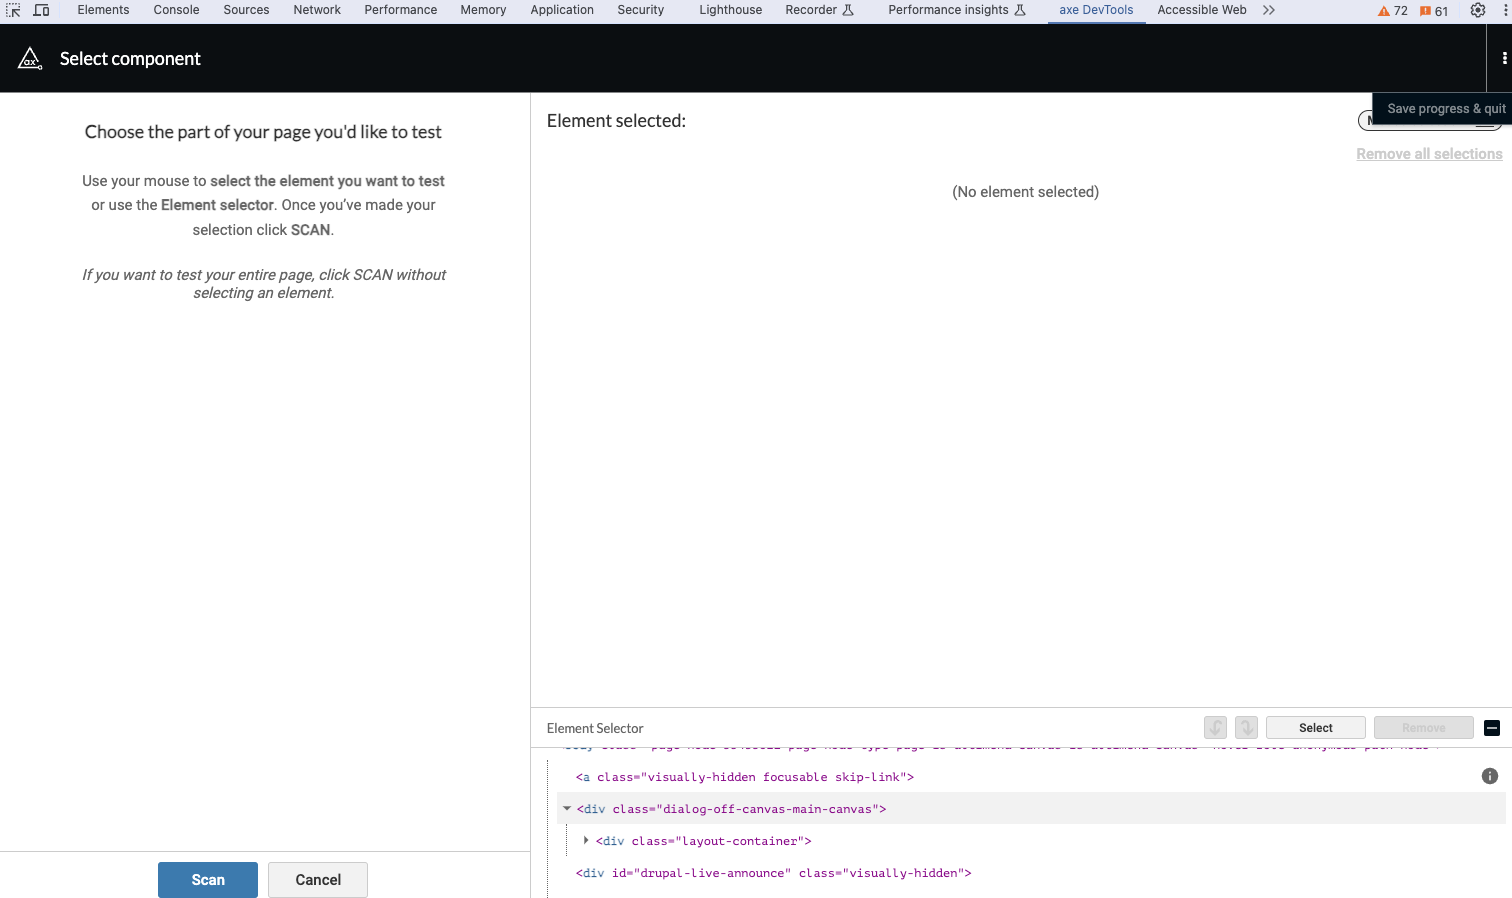
From this screen, you can select the html element that you want to scan. For all site editors, you will want to select the div.node__content to scan only the webpage body content:

You can also select the page element by viewing the code. Then click the blue Scan button on the left.
If any issues are identified, you can click on the issue for more information, and select the highlight button to see on your page what element the error is from.
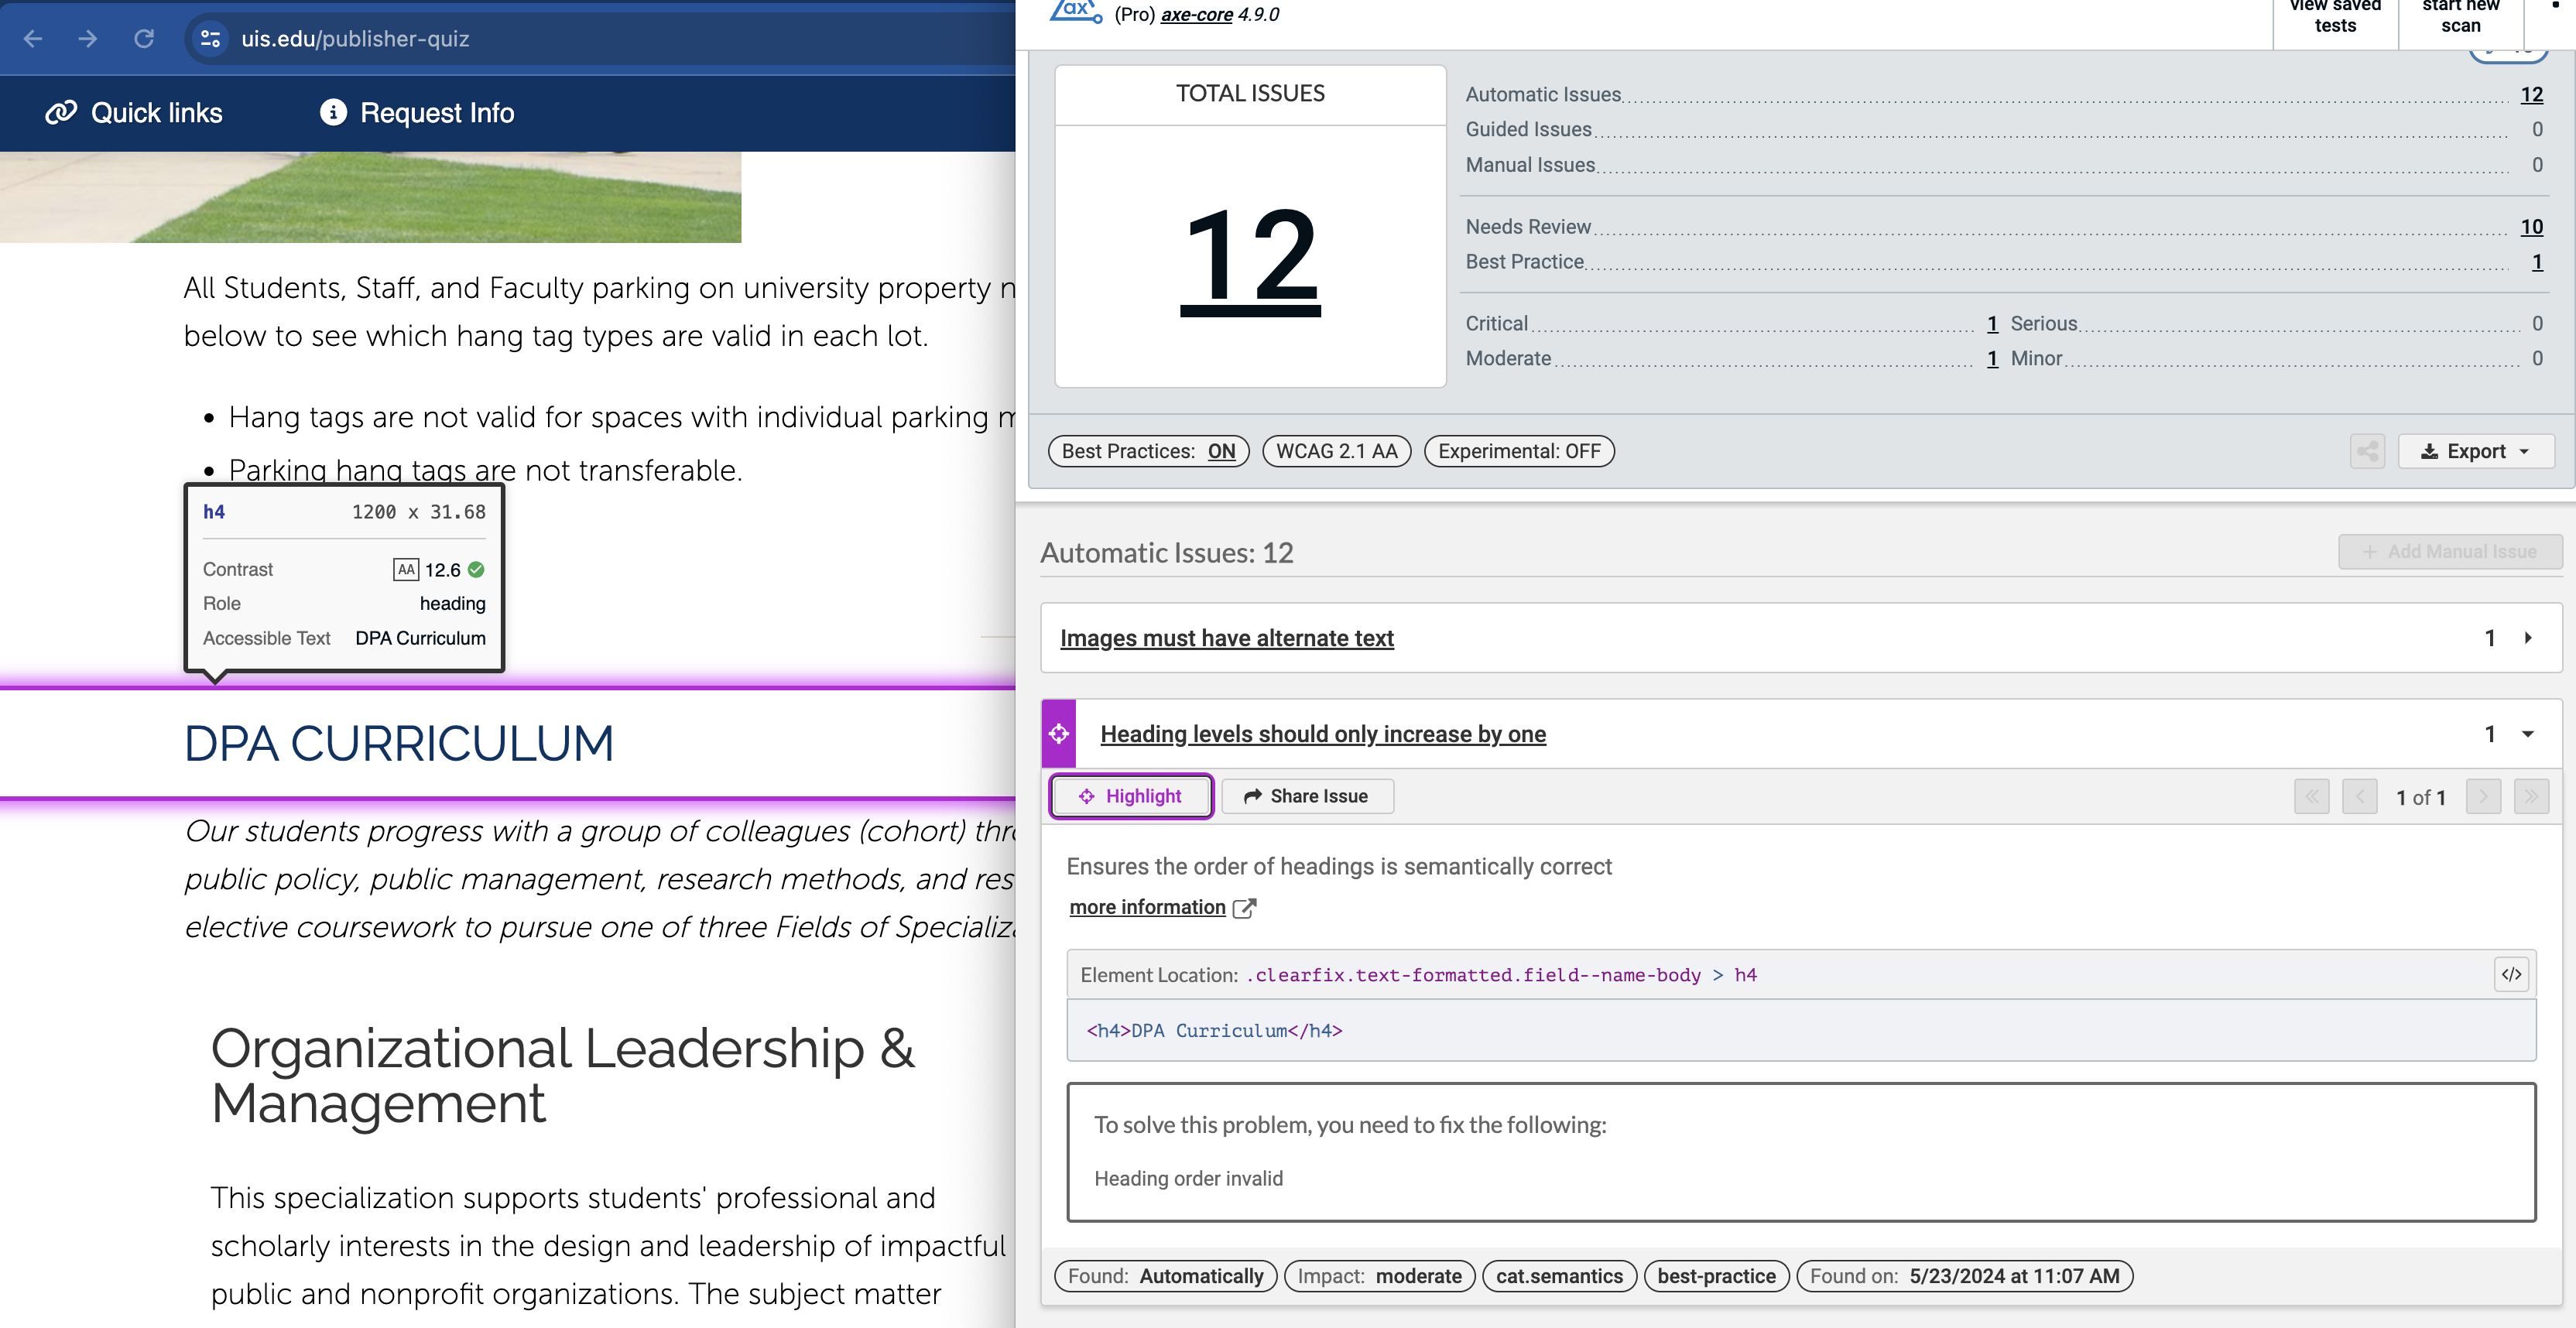
If there are Needs Review errors, typically these can be disregarded. Once you fix the identified issues, scan the page again to confirm. Once your page is free of accessibility errors and you have reviewed your content with the Content Review Guidelines to ensure the content is corrent, you can then publish the content to the site. If ever in doubt, submit your content to the Needs Review queue for review by the Office of Web and Digital Strategy.